
Michigan State and Big Ten Basketball Odds and Stats Tracker
This is your one-stop shop for all the data that you never knew you needed to understand the Big Ten race and MSU's place in it.
Throughout the Big Ten basketball season. I have historically conducted an analysis on the results of a series simulations which provides various odds regarding the trajectory of the Michigan State men's basketball season and the Big Ten race as a whole.
In addition, I have provided additional analysis of Michigan State and the Big Ten race using Kenpom efficiency data compared to historical data and the set of statistics known as the "four factors of basketball success."
As the season goes on, the data change almost daily. This post is meant to be a one-stop shop for the most updated data on the Big Ten race. In addition, this post will contain a explanation of how to read each table or figure. Analysis of the data will be done elsewhere. This post contains "just the facts."
Last Update: March 9, 2026
The Big Ten regular season is now concluded.
Enhanced Big Ten Standings
Table 1 below is what I refer to as the enhanced Big Ten standings. It includes the current Big Ten record of each team in addition to several other pieces of data.
Table 1: Enhanced Big Ten standings
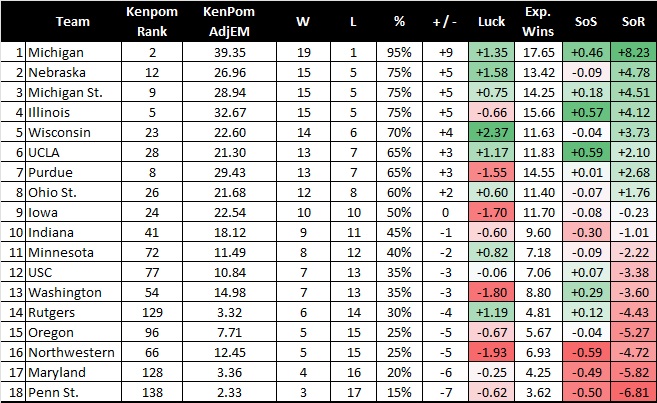
First, it contains the current Kenpom rankings and adjusted efficiency margins (AdjEM) for each team. Second, it contains the "plus/minus" for each team. The value is equal to the number of road wins minus the number of homes losses.
Third, Table 1 lists the current "luck" for each Big Ten team. I define luck as the difference between the actual number of wins and the expected number of wins so far, based on the retroactive spreads derived from the Kenpom adjusted efficiencies of each team.
Finally, the table contains the overall strength of schedule advantage/disadvantage relative to the conference average as well as the conference strength of resume.
I calculate strength of resume as the difference between the actual number of wins for each team and the number of expect wins that a reference team with a Kenpom adjusted efficiency margin of 19.00 would have with the same schedule to date.
Big Ten Conference Win Matrix
Table 2 below shows the odds that each Big Ten team will finish with any number of total conference wins, from zero to 20. This is based on a 500,000 cycle Monte Carlo simulation of the full Big Ten regular season where the current Kenpom efficiency margin for each team (also shown in Table 2) is used to project point spreads for all conference games.