
How the 2026 Big Ten Shapes Up, Part I: Michigan State and Strength of Schedule
Join us for an analytical deep dive into the overall Big Ten race and strength of schedule for the 2025-26 season
The 2025–26 college basketball season is underway, and all Big Ten teams have now completed play before the Christmas holiday break. In early December, each program also played one home and one road game in conference action, giving us an initial data set to work with.
During the Michigan State football season, I provided biweekly updates on the odds of various season outcomes, using my own power ratings along with simulations and other analytical tools to generate those probabilities. My approach to college basketball follows a similar framework.
The key difference is that for basketball, I rely more heavily on efficiency metrics — specifically those compiled by Ken Pomeroy (KenPom) — to estimate point spreads and win probabilities. These efficiency ratings correlate strongly with point spreads, and point spreads, in turn, correlate well with actual game results. There is little value in trying to reinvent that wheel.
Using updated KenPom efficiency data through December 24, I have completed my first round of simulations for the 2025–26 Big Ten season. The results, combined with additional calculations, offer meaningful insight into how the conference race may unfold. In this two-part series, I’ll walk through what those numbers suggest.
How Good is the Competition?
The single most important factor in how the Big Ten season will shake out is the relative strength of each team. Good teams tend to win more games than not-so-good teams. The best place to start in this analysis is to review the current Kenpom ranking of all 18 Big Ten teams, which I have summarized below in Figure 1.

Figure 1: Current and preseason Kenpom adjusted efficiency margins for all 18 Big Ten teams. Each bar is labeled with the Kenpom ranking as of Dec. 25.
Figure 1 includes both the current Kenpom efficiencies and rankings as well as the preseason rankings published by Kenpom on Oct. 15. Note that already a fair amount of movement has occurred in the efficiency of some of the teams.
Several teams are off to better starts than expected. Michigan, Iowa, and Nebraska have seen the biggest jump. On the other side of the ledger, Maryland, Rutgers, and Oregon have seen the biggest decline.
A glance at Figure 1 provides a quick overview of the different potential tiers of the conference.
The Michigan Wolverines currently hold the No. 1 spot in KenPom efficiency margin, with Purdue also residing in the top five at No. 5. Illinois (No. 9) and Michigan State (No. 13) are firmly positioned in the top 15, while Iowa (No. 18) and Nebraska (No. 22) round out the six Big Ten teams currently ranked inside KenPom’s top 25.
Just outside that group, Indiana (No. 31), UCLA (No. 32), and Ohio State (No. 34) sit in the low 30s, with USC (No. 38) still inside the top 40. Those 10 teams project as having a legitimate path to the NCAA Tournament. The remaining eight Big Ten programs face a much steeper climb to reach the field.
Wisconsin (No. 43), Washington (No. 47), and Northwestern (No. 54) remain inside the national top 60, while Oregon (No. 74) has stumbled out of the gate but is at least still safely inside the top 100. The remaining four teams cannot say the same.
Minnesota (No. 100), Maryland (No. 101), Penn State (No. 128), and Rutgers (No. 159) currently occupy the bottom tier of the Big Ten in KenPom.
That said, significant movement should be expected between now and Selection Sunday. At this point last season, eventual Big Ten regular-season champion Michigan State ranked just fourth in the conference, trailing Maryland, Oregon, and UCLA.
Similarly, Ohio State ultimately missed the NCAA Tournament last year, but in late December 2024 the Buckeyes owned a stronger KenPom efficiency margin than Wisconsin — a Badgers team that went on to earn a No. 4 seed, second only to Michigan State among Big Ten teams.
Strength of Schedule
In an ideal world, the Big Ten regular-season schedule would consist of 34 conference games, allowing each team to play every opponent twice—once at home and once on the road. Instead, the league plays a 20-game conference schedule. As a result, each Big Ten team faces only three opponents twice, seven opponents only at home, and seven opponents only on the road.
This structure inevitably creates schedule imbalance, benefiting some teams while disadvantaging others. The natural questions, then, are how large that effect is and which programs gain—or lose—the most from it.
Table 1 below presents a matrix summarizing the full Big Ten schedule.
Table 1: Big Ten composite schedule showing each team's double-play opponents (in white), home only opponents (green for the team in question's row) and road only (shaded yellow).
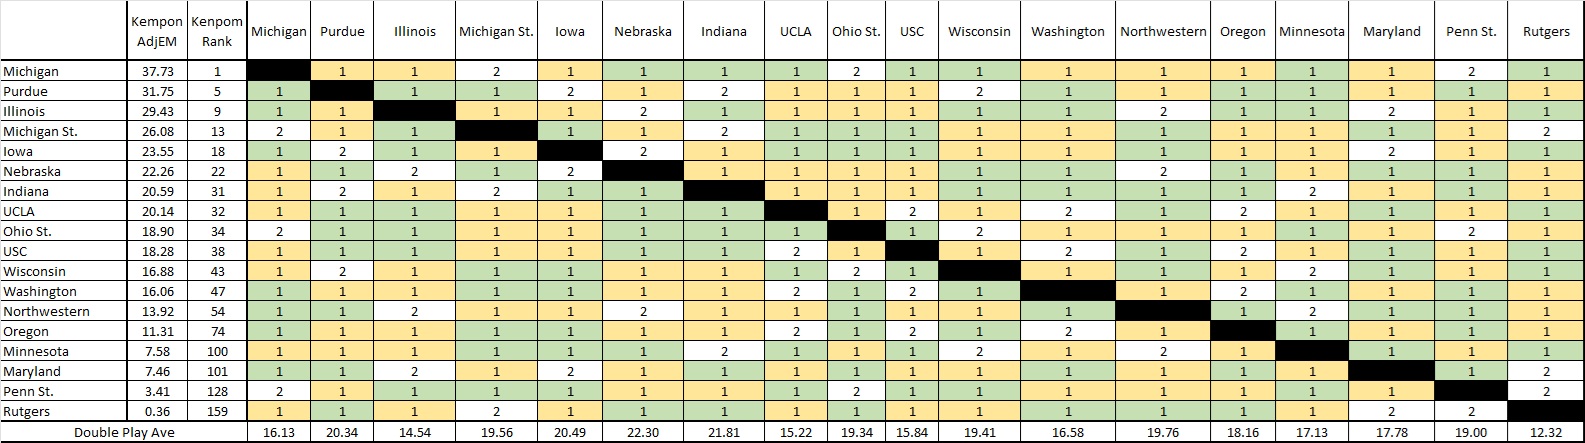
In the matrix, white cells indicate opponents that play each other twice during the regular season. Green-shaded cells represent single-game matchups in which the team listed in the row plays at home, while yellow-shaded cells indicate single-game matchups in which the team in the row plays on the road.
For example, Michigan State will play Michigan, Indiana, and Rutgers twice. The Spartans will face Purdue, Nebraska, Wisconsin, Washington, Oregon, Minnesota, and Penn State only on the road, while drawing Illinois, Iowa, UCLA, USC, Ohio State, Northwestern, and Maryland only at home.
A quick glance at Table 1 provides an initial sense of each team’s schedule difficulty. Rows (or columns) with a higher concentration of “2s” on the left-hand side (or top) and more “1s” on the right or bottom generally indicate a more challenging schedule, and vice versa.
A more quantitative signal appears in the table’s bottom row, which reports the average efficiency margin of each team’s twice-played opponents. Higher values suggest a tougher schedule, as they indicate more games against stronger teams and fewer opportunities to play weaker opponents multiple times.
Subscribe to Spartans Illustrated to continue reading this article. The rest of this article moves beyond surface-level schedule talk and into the math that actually separates contenders from pretenders.
Subscribers get the full strength-of-schedule analysis, including:
A mathematically rigorous comparison of every Big Ten schedule using expected win probability
Clear answers to who really benefits from the league’s imbalanced format—and who doesn’t
An adjusted model that removes the built-in advantage of teams not playing themselves
What the numbers say specifically about Michigan State’s true position in the Big Ten race